Getting Started#
Overview#
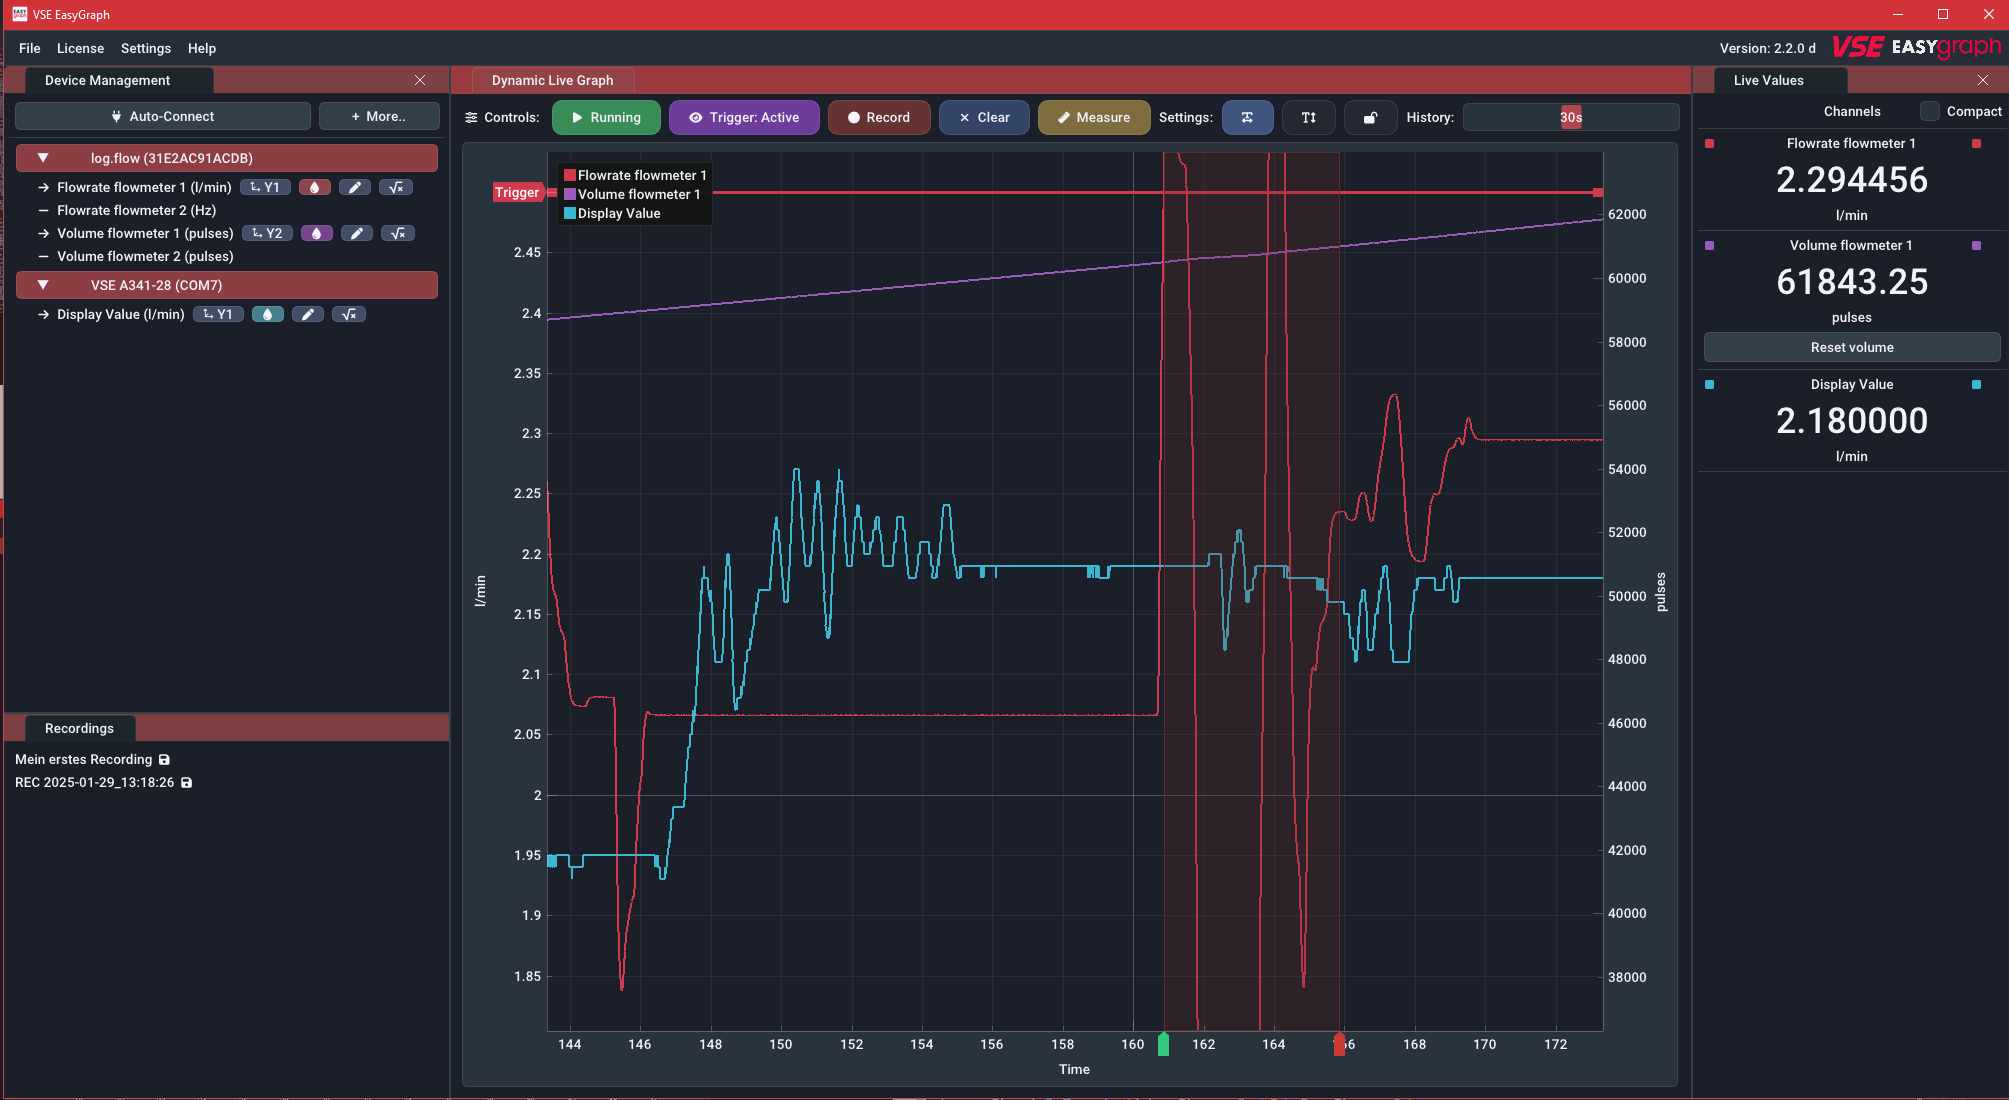
On the first software start you will be presented with the following screen:

- Device management panel: This panel manages all device connections. Once the license keys are entered, you can use the
Auto-Connectbutton to connect to log.flow or IO.flow devices that are attached to the computer. For other device types you can use theMorebutton to manually connect via a COM-Port. This panel allows you to modify device parameters and select/edit any channel the device provides. - Live graph panel: This panel shows either the measured values streaming from the connected devices or the measured values from a previously recorded file. The X-Axis shows the time since the value is measured. When live values are streaming in, the rightmost value corresponds to the current value. The plot supports multiple channels which will be displayed in different colors. There are up to three Y-Axes (left/right) for seperating the flowrate, volume and analog values on their own axis.
- Live value panel: This panel shows the current values as a text/number.
- Recordings panel: This panel lists all ongoing and finished recordings. You can open (double-click) and manage (right-click) them from here. It is usually hidden if no recordings are present.
The first step after opening the software is usually connecting to an external datalogging device. In order to do that, use the Auto-Connect and More buttons in the Device management panel. When first using this software, a suitable license key must be provided. This will be explained in the next chapter.
Help: Panel is not visible
You can always make panels visible again using the Settings menu in the top menu bar and checking the panel that you want to re-enable.
Software Activation#
The activation procedure depends on the on the device you got the EasyGraph software with:
- If you are using the software with a log.flow datalogger, the license is hardware-bound to the specific log.flow device and the serial number matching this device needs to be entered. The whole process works without an internet connection.
- If you are using the software with any other hardware (e.g. IO.flow®, Evaluation units like A341, A350 or FU210), an online license activation needs to be performed in order to use the software.
Log.flow Activation#
The following video shows how to enter the serial number key in order to activate the software. Multiple serial keys for different log.flow devices can be saved and managed. The dashes ( - ) in the serial key do not need to be entered.
By right-clicking, you can also add a label to the key to remember which device it belongs to. Alternatively you could for example add your customer id here to find it easily later when you want to update the software.
Online Activation#
Hint: Online-only
On each software start, the software requires an internet connection to verify the validity of the license key.
Supported Devices: IO.flow® with USB-Master, A341, A350, FU210
After purchase you will receive an email with the license key. After entering this key into the software (see video below), you will be able to connect to all supported device types.
Using the device menu in the top bar you can also edit or remove the license key from the computer. This could be required if you have exceeded the activation limit and want to activate it on another pc.
The first recording#
Etablishing a connection#
In order to establish a device connection, make sure the device is connected properly to the computer and turned on. For help with this refer to the device specific connection instructions.
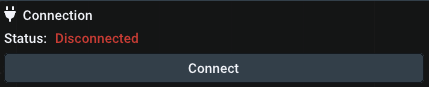
In the Device management panel use the Auto-Connect button to start the connection process which should be fully automatic (except for the Display/FU option where a COM-Port has to be selected using the More button). If a connection can't be established, you may have not entered a license key, as described in the previous chapter.
When the connection is established, it will be added to the device list below the Auto-Connect button. An active device connection is indicated by the red device entry. The currently measured values will be shown in the Live value panel and the Live graph panel.
Help: I only see zero values
Make sure you have powered your sensors with 24V and they output the right signal levels (HTL). If you use log.flow, refer to this section to get more info about powering your sensors.
Plot navigation#
Use your mouse to navigate the plot window. Refer to the following video:
Recording#
Starting a recording is as easy as clicking the RECORD button with the left mouse button. If you want to directly specify a custom filename, right-click the RECORD button or shift-click it.
All currently visible channels will be recorded. Disabled but available channels will therefore NOT be recorded!
You will also notice green START and red STOP indicators in the timeline and a new entry in the recordings panel in the bottom left corner.


To open the recorded data, double-click on the entry in the recordings panel. A new tab will appear on top of the live plot panel that starts with File: and the name of the recording. You can navigate this recording in the same way as the live plot.
Recording files do not autosave!
It is important to note that in this state recordings are not saved to disk yet and stay in volatile RAM until you export them to a file. To export the file, decide between a full data export or a PDF output for printing.
-
For a full data export (that can be re-imported later) right-click on the entry in the recordings list or under the
Filemenu and selectSave as..Protobuf-File [.bin]. -
For a PDF report, right-click on the entry in the recordings list or under the
Filemenu and selectSave as..Report [.pdf].
After a successful export the icon will turn into a icon.