Evaluate Recordings
Evaluation workflow
- Open recording in the file viewer.
- Use zoom/pan for region-of-interest isolation.
- Place cursors to measure time and value differences.
- Review statistics (max/min/delta/average).
- Crop and export result for reporting (e.g. PDF).
Cursor-based analysis
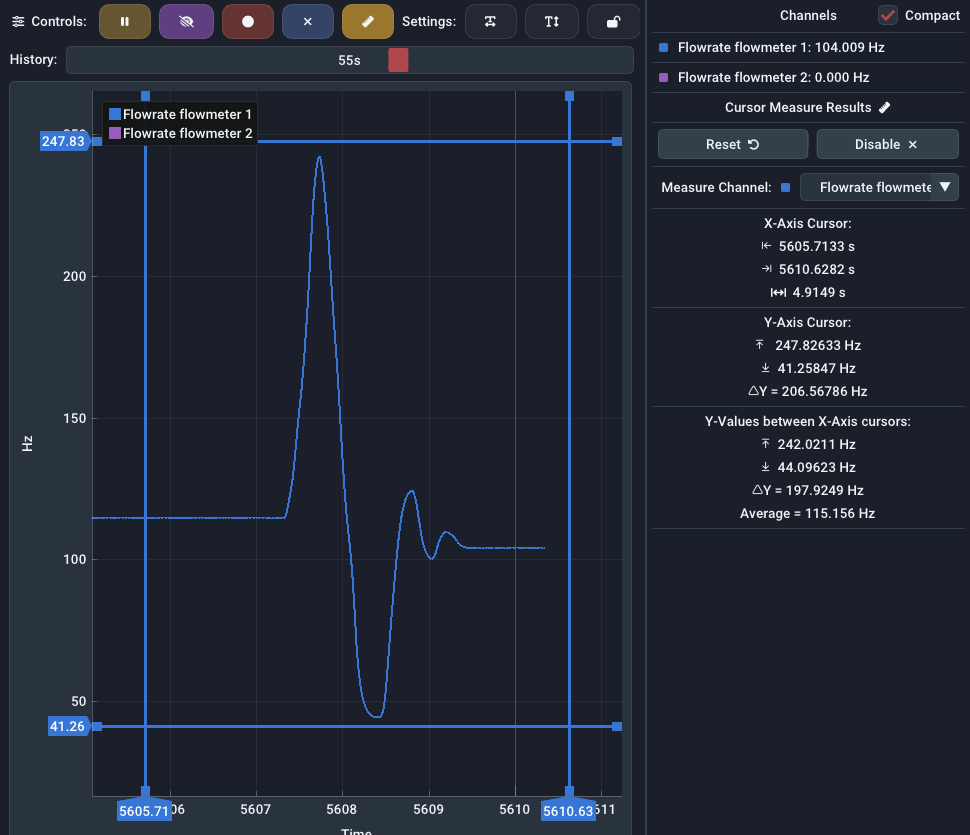
Cursor measurement can be enabled by using the Measure button in the live graph or file graph panel. After enabling, movable cursors appear in the live plot window. You can move them by left clicking and dragging the lines or their little rectangle handles at the plot's edges. Once activated in live-view, the Auto-Scroll and AutoScale functions are disabled automatically.
Below the live values in the rightmost panel, you will find the measured values between the cursor lines. Here you can also select the channel, that you want to measure on, using the combo box.
The measurement is grouped into three sections:
- X-Axis: In the first section the time values at the X-Axis cursors together with the difference (
delta) between them. - Y-Axis: The second section contains the values at the Y-Axis cursors based on the selected channel. Their difference is also shown here.
- Values: The third section will display a statistical evaluation of all measured Y-values of the selected channel between the X-Axis cursors. You can see the maximum, minimum, difference and average of all values in-between. Y-Axis cursors have no effect here.
Cropping and focused datasets
Use crop functionality to isolate relevant phases of a measurement:
Exact workflow:
Cropping is currently destructive
Save the file first before cropping if you may need to undo later. EasyGraph works memory-first, and recordings are not necessarily saved to disk yet.
- Open the recording in the file viewer.
- Zoom roughly into the region of interest.
- Invoke the crop tool by pressing the Crop button in the top bar.
- Place appearing green/red X-cursors at desired start and end boundaries.
- Apply crop using the Apply button.
- Verify resulting dataset.
- Save cropped output as a new file to preserve original data.
Scope and implications:
- Cropping applies to the active recording/file tab only.
- The operation changes the working dataset in-memory.
- Cropping does not automatically save or overwrite the last saved file on disk.
- If you want to keep the cropped result, you must
saveorsave asafterwards. - If you already saved the original file before cropping, you can discard the modified in-memory file and reload the original from disk.
- If you crop an unsaved in-memory recording and want to undo later, that is currently not possible.
Reporting and handover
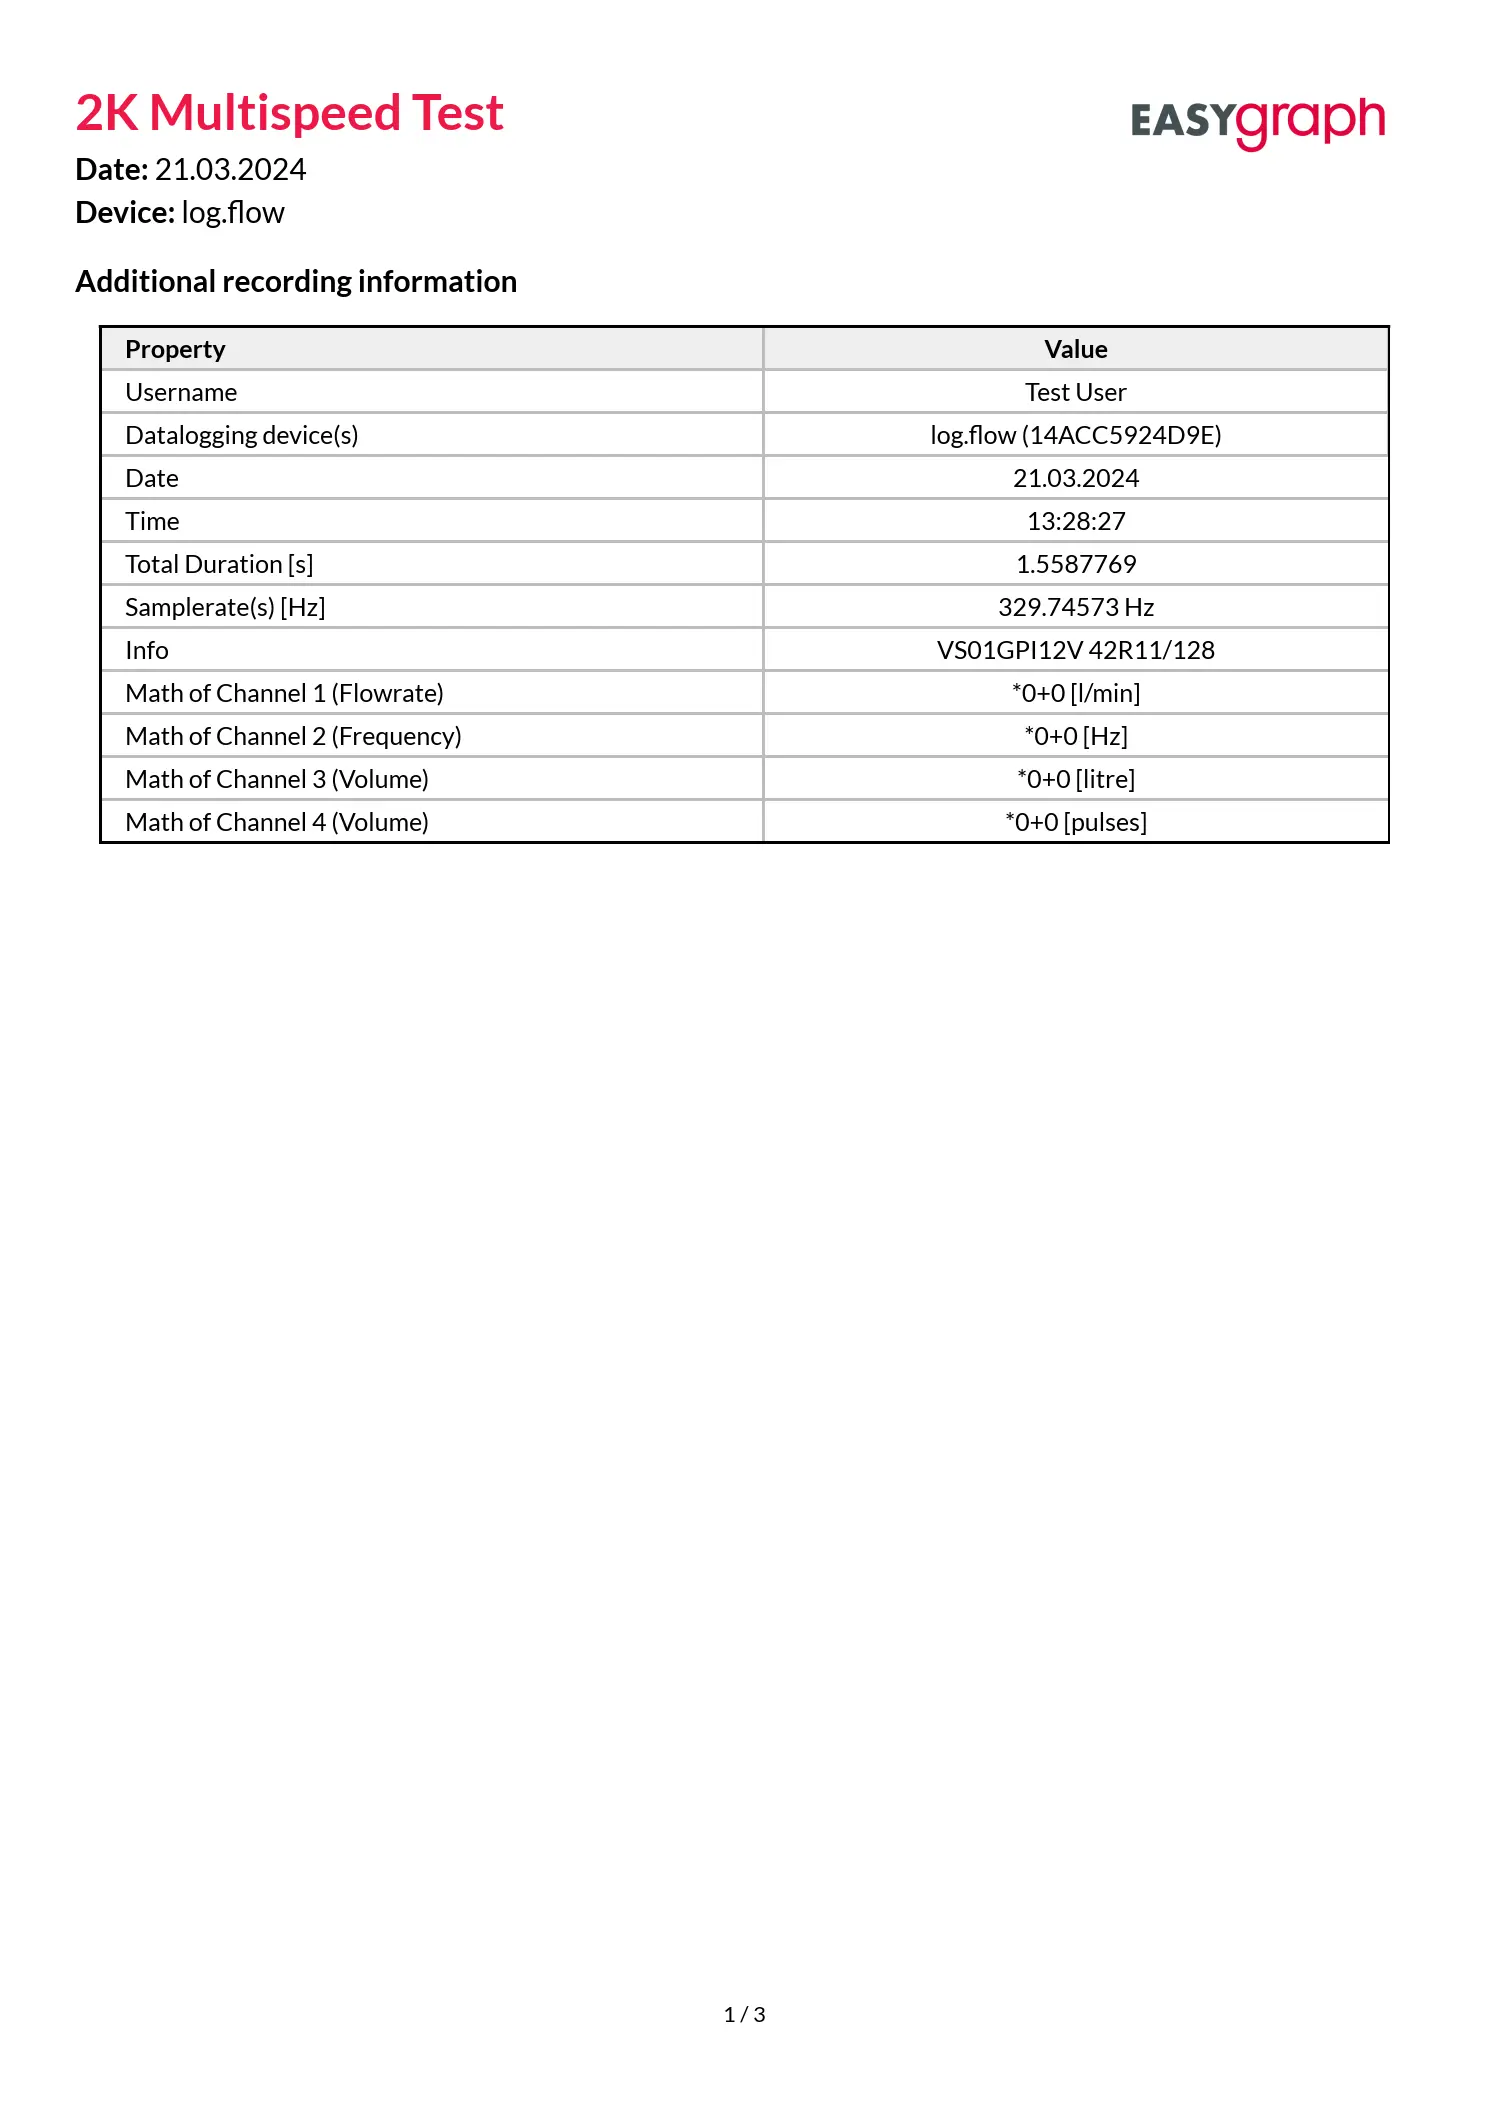
EasyGraph can generate multi-page A4 PDF reports that contain useful metadata about the measurement and fullsize plots on separate pages. Each base unit (frequency, count, analog) will get a separate plot page.
Export strategy:
- Keep a copy in binary format (
.bin) for re-analysis - Generate PDF for communication and review meetings
- Use metadata fields (
RecordingProperties) for test traceability
Reference: Filetypes + Import/Export.