Getting Started
Overview
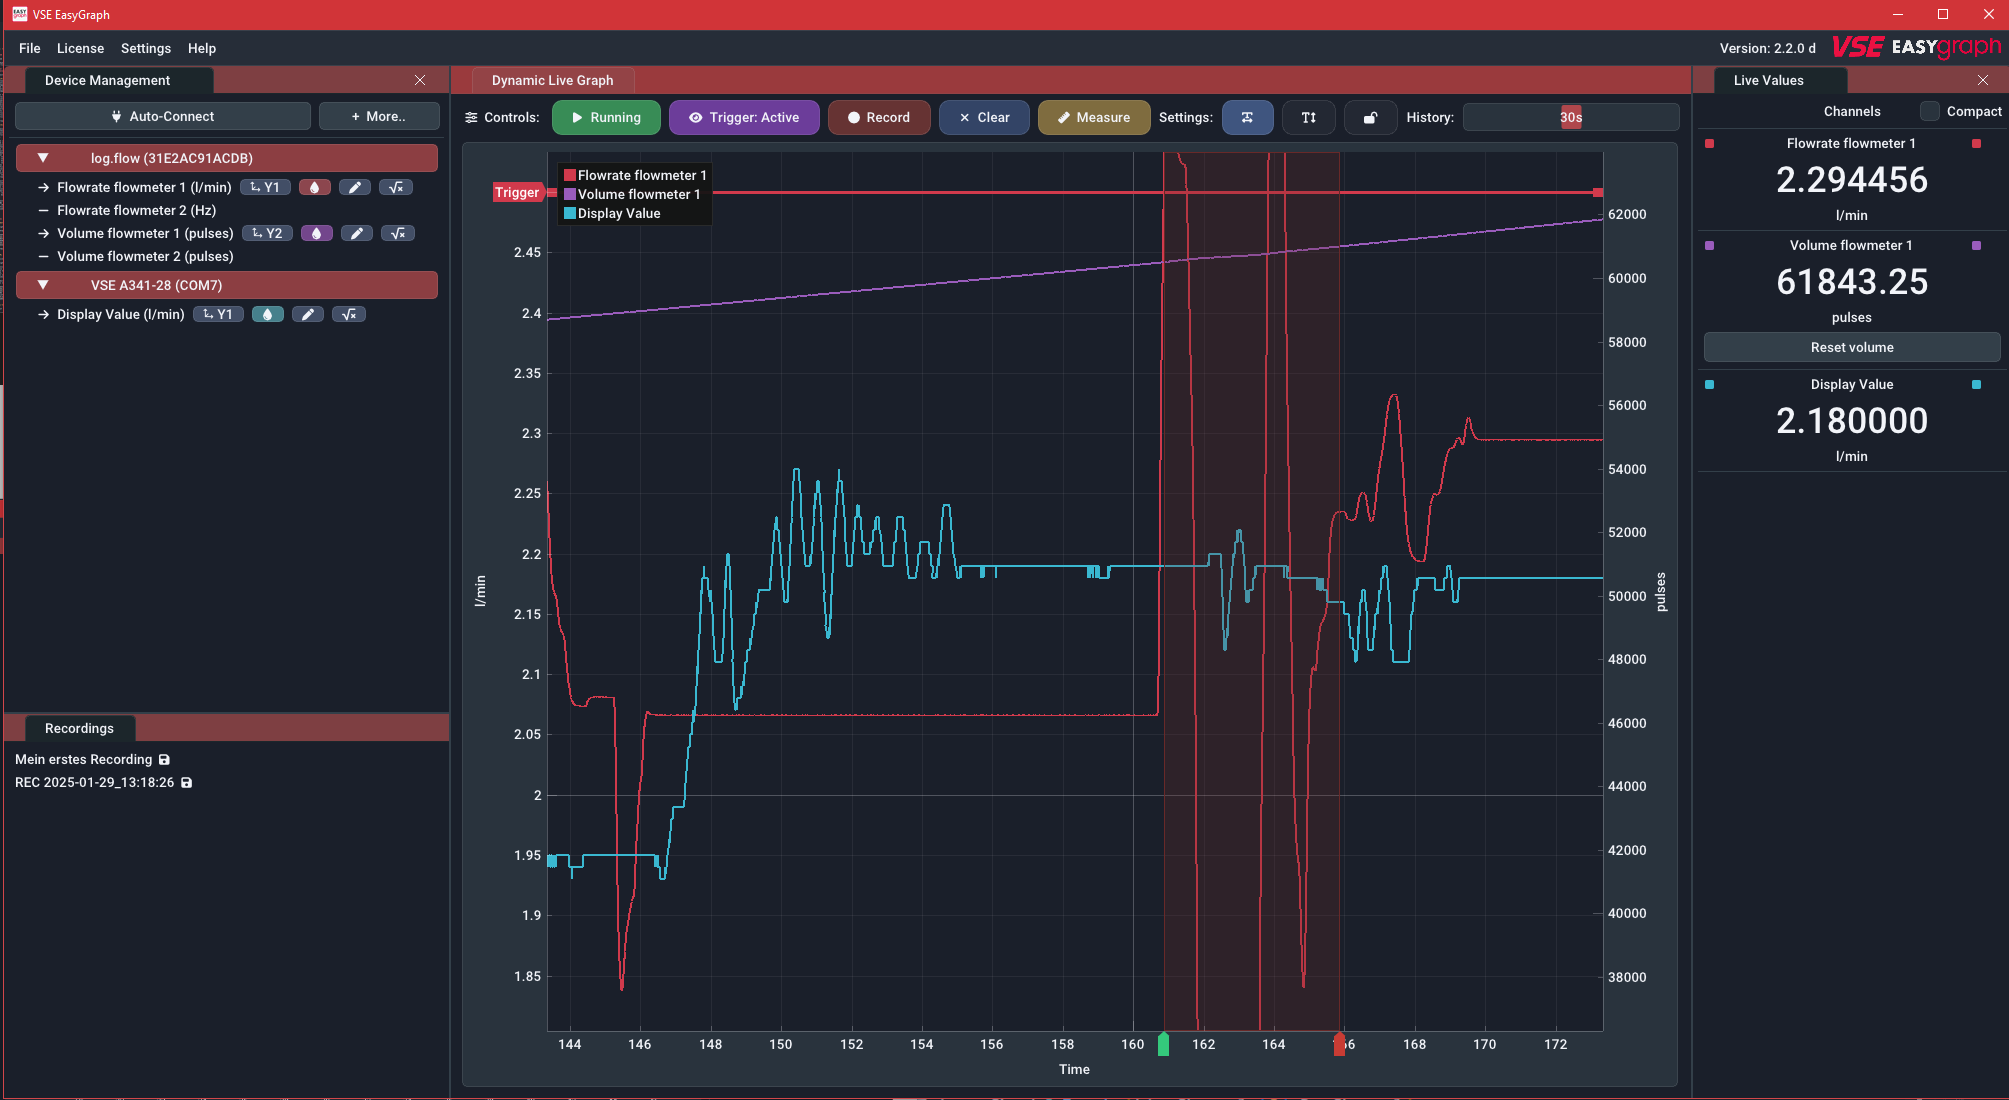
On the first software start you will be presented with the following screen:

- Main menu bar: Open files, manage license keys, add math channels, access to program settings and to this manual via the Help menu.
- Device management panel: This panel manages all device connections. Once the license keys are entered, you can use the Auto-Connect button to connect to log.flow or IO.flow® devices that are attached to the computer. For other device types you can use the More button to manually connect via a COM-Port. This panel allows you to modify device parameters1 and select/edit any channel the device provides.
- Recordings panel: This panel lists all ongoing and finished recordings. You can open (Left Doubleclick) and manage (Right Button) them from here. Hidden when no recordings are present.
- Live graph panel: This panel shows either the measured values streaming from the connected devices or the measured values from a previously recorded file. The X-Axis shows the time. Live values stream in from the right to the left. The plot supports multiple channels which will be displayed in different colors. There are up to three Y-Axes for seperating the flowrate, volume and analog values on their own axis.
- Live value panel: This panel shows the current live values as a text/number.
The first step after opening the software is connecting to an external datalogging device. Use the Auto-Connect and More buttons in the Device management panel to do so.
First time? Activate your license first
Before connecting a device for the first time, make sure your license is set up. See License Activation for the step-by-step instructions for your device type.
The first recording
Etablishing a connection
To establish a device connection, make sure the device is connected properly to the computer and turned on. For help with this refer to the device specific connection instructions.
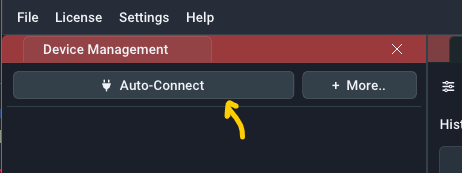
In the Device management panel use the Auto-Connect button to start the connection process or manually select a COM-Port using the More button. If a connection can't be established, you may have not entered a license key.
When the connection is established, it will be added to the device list below the Auto-Connect button. An active device connection is indicated by the red device entry. The currently measured values will be shown in the Live value panel and the Live graph panel.
Help: I only see zero values
Make sure you have powered your sensors with 24V and they output the right signal levels (HTL). If you use log.flow, refer to Power supply configuration for more information about powering your sensors.
Plot navigation
Use your mouse to navigate the plot window. Refer to the following video:
For more detailed explainations of the user interface refer to the UI Guide.
Recording
Starting a recording is as easy as clicking the Record button with the left mouse button. If you want to directly specify a custom filename, Right Button the Record button or Shift+Left Button it.
Only visible channels are recorded
All currently visible channels will be recorded. Disabled but available channels will therefore not be recorded!
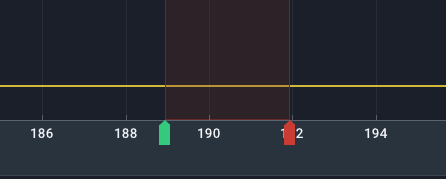
You will also notice green START and red STOP indicators in the timeline and a new entry in the recordings panel in the bottom left corner.

To open the recorded data, double-click on the entry in the recordings panel. A new tab will appear on top of the live plot panel that starts with File: and the name of the recording. You can navigate this recording in the same way as the live plot. The icon next to the file means that this file is currently in unsaved state.
Recording files do not Auto-Save!
It is important to note that in this state recordings are not saved to disk yet and stay in volatile RAM until you export them to a re-importable filetype. In newer EasyGraph versions there is a auto-backup functionality that will take care of temporarily storing unsaved files in case the program closes.
-
For a full data export (that can be re-imported later) click using Right Button on the entry in the recordings list or under the File menu and select Save as.. Protobuf-File [.bin].
-
For a PDF report, click using Right Button on the entry in the recordings list or under the File menu and select Save as.. Report [.pdf].
After a successful export the icon will turn into a icon.
This whole process will be explained in-depth in the Recording & Triggering and Evaluate Recordings sections.
What's next?
You can now proceed and parametrize your connected hardware to your measurement application
Either learn how to use the input fields and user interface or directly dive into the hardware specific parametrization.
Parameterization workflow
- Connect device and verify live stream.
- Open device property panel.
- Set sample rate and filtering2 for the target dynamics.
- Enable or disable channels, assign colors and axes.
- Setup channel names and units via math and scaling.
- Save device settings or presets where applicable.
-
To open device property panel, click Right Button on the connected device's header. ↩
-
!!! tip "Tip: Sampling and filtering" - Higher sample rates improve time resolution but increase data volume. - Filtering can stabilize noisy readings but introduces response delay. - Choose settings based on test objective (transient capture vs. trend monitoring).